2018-02-28
It was the winter of 2010. Mr. Murphy had a whale of a time with us fledgling professors at one of the premium centres of technology in the country. IIT Madras.
Murphy’s laws proved right.
Everything went wrong - the promised projector was out, our taxi had a flat tyre, my fellow professor’s laptop wouldn’t boot up, the students showed up on time for the class.
All disasters.
In spite of all these setbacks, Prakash (my co-professor) and I had a blast with the students. The students presented a few socially relevant problems that they were going to work on. My rest of the post will talk about one such case where visual representation helped us assimilate what the students initially attempted to explain through words. In the process, you can learn a thing or two about representing a system visually.
Rude shock
“No Projector?” asked Prakash, looking at the usual spots where projectors were.
“Yes, Sir” said the student. I scanned the faces of the rest of the students. I could literally read their minds - “How are these guys going to hold up for two days? Not a chance.”
“Not even a portable one?” Prakash couldn’t believe that we had overlooked this minor detail in our planning for the 2-day workshop course module.
“Sir, we can go look around and find out if there are rooms available with projectors in them,” another student volunteered.
I was a bit taken aback by the enthusiasm of the students to get the class up and running. I was not like them when I was a student at the same place a decade or so ago. If the prof couldn’t take the class, plain and simple - leave the class and go to your dorm/hostel room and do nothing. Aahh, plain and simple days of the past!
Prakash gave me a toothy grin and shrugged. He took a marker in his hand and went up to the white board. He wrote “TRIZ” right in the middle of the board. I’d reckon he’d gone for a 96 pt Times New Roman font. Good choice, Prakash!
“This is what we’ll do for the rest of the time without any gadgets. Call it the Alshullerian way.” He referred to the founder of the inventive methodology (TRIZ), Genrich Altshuller.
Flounder
The moment we started the session, we bid farewell to Mr. Murphy. The students participated in the sessions with their hearts. So much so, that some of the explanations they gave didn’t make much sense to us.
Still, we nodded as if we understood every bit of what they said and even worse pretended as if we remembered all the teeny tiny details of the problem that they were working on.
“It’s only words and words are all I have”
We gave them another chance to explain themselves in plain english by removing specific terms from their explanation. We gave a thumb rule that they should be able to explain it to someone with almost no training in their field.
For example, “Can you explain this to your granddmother?” “What about a fifth-grader?”
After this sage-like advice, they did comply to an extent, but we still had a barrage of words to deal with and found it difficult.
Draw? Me? Are you kidding?
It was lunch time. Prakash and I were overwhelmed and we saw no respite to this “barrage of words” problem. We discussed the Himalayan problem presented in front of us at IIT Madras canteen, aptly called the Himalaya Canteen.
How do we get the students to talk about their problem very clearly?
We looked at everything around us and went silently about our tasty lunches.
Prakash broke the silence with a big broad smile on his face. Something told me that he had cracked the case.
“You know, for a premier instituition of the country, the food is quite bland,” said Prakash.
“Well, it prepares you for life. Now, you are officially equipped to handle anyone’s cooking, even your own, after sending this food down your system. Look at me, I haven’t complained about food since 1997, year of my graduation.”
“Anyways, I got a great idea. How about we ask the students to draw?”
“Draw? As in use pencil and paper to actually draw something?”
I scanned Prakash’s face for hints of sarcasm. I didn’t find any. He was sweating in spite of the winter time at Chennai. OK, that’s nature’s sarcasm.
Four steps to instant karma
Back in class. As always, all the students were there.
“Good afternoon! Welcome back to our TRIZ Innovation workshop. We noticed that you have excellent problems to work on, however, you were not able to express yourself as well as we wanted you to. So, here goes. You will have to draw your problem out,” Prakash said and paused for effect.
Students started to grumble, mutter and shift about. Some of them were kind enough to yawn on our faces to let us know about the enthusiasm they had for the idea.
“Sir, we haven’t drawn anything since we were 9 years old. It is unfair that there are some teams with people who can draw and they’ll ace the course, " said a hyper-enthusiastic student, with worry lines etching his face.
“Right. Point taken. How about we make it into four easy steps that will make sure that anyone can draw?” Prakash thundered on.
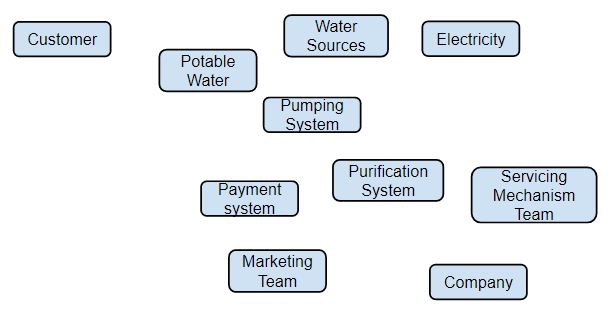
- List Objects of the System - Think about what all goes into making up your system. Think of components. Write them on a piece of paper. Tip - Circle them after you’ve written their names.
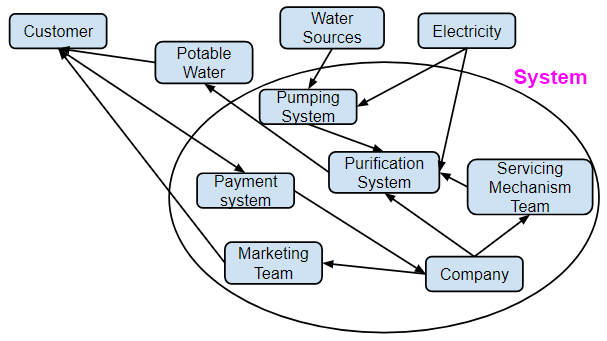
- Connect the Objects - Now connect them using arrows. Put in verbs between the objects to specify what one is doing to another.
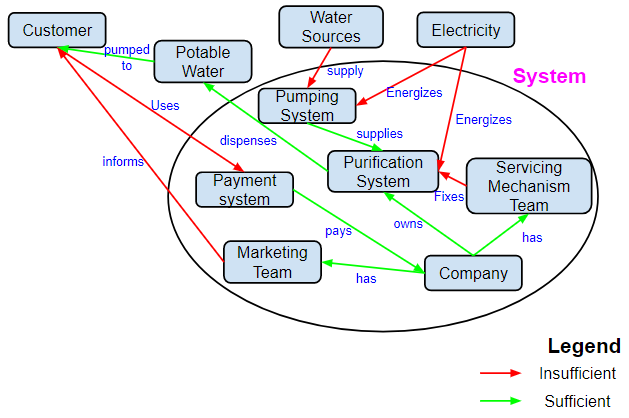
- Classify the relationships with a legend - Classify the arrow as “insufficient” and “sufficient” and give it your own legend
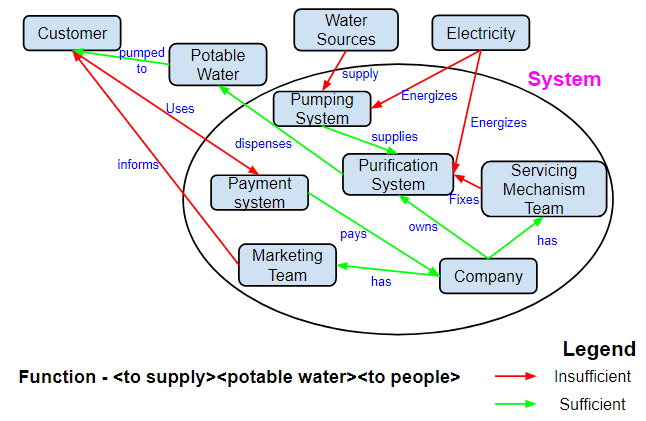
- Write the function - Write down the function that your system performs, at the bottom of the chart or paper.
“Here, let me show it to you,” said Prakash. He went on to draw a function map for Prakash’s favourite object - the marker pen.
Clarity has a new name - Function map
Well, the four steps to chart out your system pictographically is given below:
Step 1 - List Objects of the System
Step 2 - Connect the Objects
Step 3 - Classify the relationships with a legend
Step 4 - Write the Function
And, there’s that too
I guess I don’t have to explain what the students tried to depict or it would defeat the point of this post :) Anyways, the students went ahead and creatively solved the problems depicted in the example function map. The result is given in the following image:
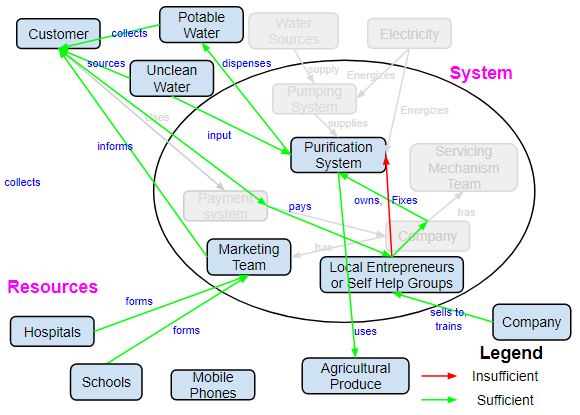
Well, they came up with a “husky” (rice husk based) water purification system and a very innovative business model which won them several laurels at international levels.
Prakash and I finished two long days of workshop without a single slide being projected. The students showed up in full strength without the fear/lure of attendance or grades.
All in all, it was a picture worth painting.
You can also check out
About the Author
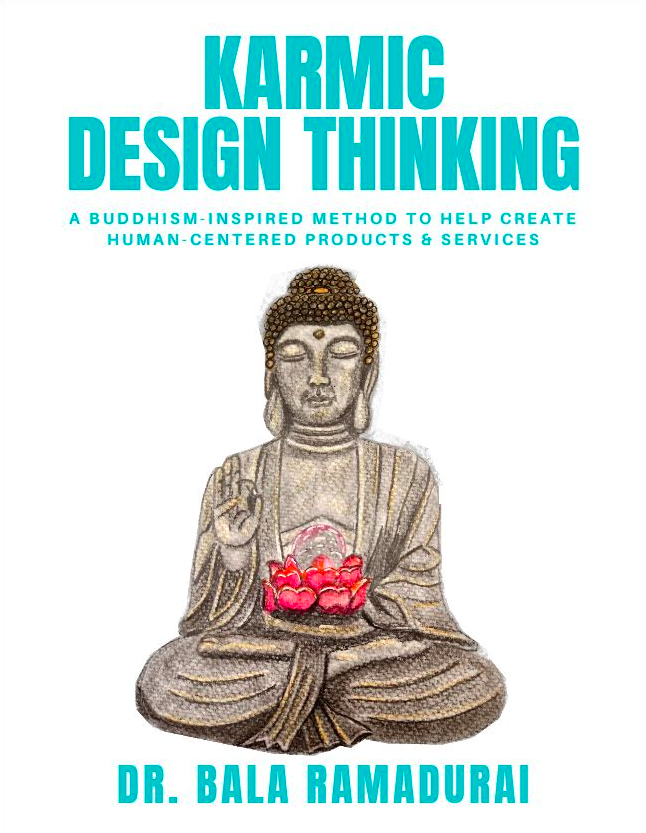
Dr. Bala Ramadurai
Author, Prof & Consultant
Dr. Bala Ramadurai is an author, professor and consultant. He has authored a book on Design Thinking called Karmic Design Thinking. He has 3 patents to his credit and 10+ publications in international research journals. He co-founded TRIZ Innovation India and is an Adjunct Professor at Symbiosis Institute of Business Management, India. He is a professor at National Programme on Technology Enhanced Learning. About me